The Problem
Let's say that you have some data, which is spread over time and you want to be able to create a BI visualisation showing how that value changes as a delta from the previous value.Implementing a solution
To walk through how to do this, in a way which is hopefully easy to follow, I'm going to grab some sample data which is available on-line. That data is is the Annual Sheep Population in England & Wales 1867 - 1939 (measured in 1000's) from DataMarket. No idea why I picked sheep populations but there we go.The goal here is to be able to create a simple chart which can show the sheep population for a given year and the population difference from the previous year (except for 1867 which should show a difference of 0).
So step 1 is to go and download the data, I've opted for CSV for this example but if you want to try another format then go for it. Once you've downloaded the data fire up Power BI.
Connecting to the data source
Once Power BI has opened hit "Get Data" to connect to your data source and follow these steps: |
| Getting data into Power BI |
- Select the CSV connector
- Navigate to and open the sample data set from your local machine
- Once the preview window has opened select the "Edit" button
Configuring your data source
One of the first things I've done is renamed the query over in the Query Properties section to "sheep", you don't have to do this but it makes things easier to read for me and also makes the screen shots a little less cluttered.If you look at your data in the Query Editor window and scroll to the bottom you'll see that there are 3 rows which were in the CSV file which aren't part of the data. To get rid of these select the "Remove Rows" button from the ribbon and then select the "Remove Bottom Rows" option. When the option dialog appears enter the value "3" and press "OK", this will remove the rows from the bottom of the data set (scroll down and check).
 |
| Removing rows from the query |
Now right-click on each column title and under "Change Type" select the "Whole Number" option. This will ensure that we are working with the data correctly, and you'll notice that the year was mostly likely set to "Text" because of the content of the rows we previously removed.
Almost there, now we need to sort the "Year" column in ascending order, you can use the options in the ribbon or click on the drop-down menu next to the column title and select the correct sort option.
Finally we need to add an index column (we'll see why in a bit) to the data source, in the "Add Column" ribbon. If you don't select any options then the default is to start from zero, which we'll do in this example, but you can choose to start from 1 or a custom value with a custom increment. You can leave this new column name as Index.
 |
| Adding the index column |
Creating the new population difference column
Back in Power BI we'll need to be under the "Data" section on the left.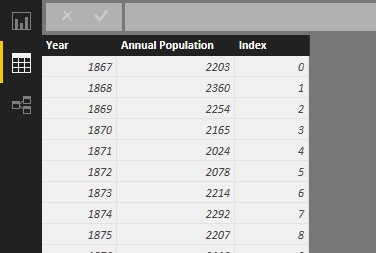 |
| Viewing the data in Power BI |
 |
| Adding a new column to the query |
Column = SUM(sheep[Annual Population])This will give us a new column called column where every row will now have the sum of the Annual Population column.
 |
| Our first new column |
Population Difference =That's quite a lot to take in so we'll break it down a bit and talk through what this is doing.
'sheep'[Annual Population] - IF(
'sheep'[Index] = 0,
'sheep'[Annual Population],
LOOKUPVALUE(
'sheep'[Annual Population],
'sheep'[Index],
'sheep'[Index]-1)
)
The first bit is quite simple as we're just saying to take the current sheep population and subtract a number from it. When we get to the IF statement we're checking to see if the current Index is 0 (I created my Index column to start from zero) and if it is return the current sheep population, this is so that we get a difference value of 0. If the current index is not zero then we're doing a lookup, with this we're looking up the sheep population value by checking the Index column for a value which is the current Index value less 1 (i.e. the previous value).
If we change our column to this expression we should get the following.
 |
| Our data with a population difference value |
Visualizing the data
From here we can go back into the Reports section and create a number of visualizations against this data. Here I've provided an example where I'm using the "Line and Stacked Column Chart" visualization with the annual population for the column values and the population difference for the population difference. Play around with it and see what looks good for you though. |
| Visualizing the data |
I've provided the data and the pbix file for download if you want to have a look at the version I've put together and play around with it. Just click on the OneDrive link below.